Complex data tables on mobile
Designing a template for complex data tables was part of an admin redesign for a b2b service that enables entrepreneurs to run online gambling sites by renting them e-gaming platforms. The overarching goal of the admin is giving entrepreneurs full control over products, players, and operations. Integral to that is reporting: providing detailed breakdown to key areas of operation by making live data available.
Basically tables. Complex tables, with lots of data that users need to be able to view, sort, narrow, search, and restructure—even on the go! The challenge was coming up with a table template that does all of these, despite the constraints of space on mobile.

Full scope of project
This case study focuses on the subject of tables, without attempting to discuss the entire project. The full scope of the project entailed product design starting from discovering requirements, user and business needs, competitive analysis, writing users stories, prioritising features, planning design sprints, revising and restructuring information architecture, UX&UI design, developing a design system, and different sets of specifications for design and for content. I was supported by a UX researcher.

Expand row function
An alternative to viewing a row by scrolling. The contents of each row can be viewed as a list, revealed by expanding the row accordion style.

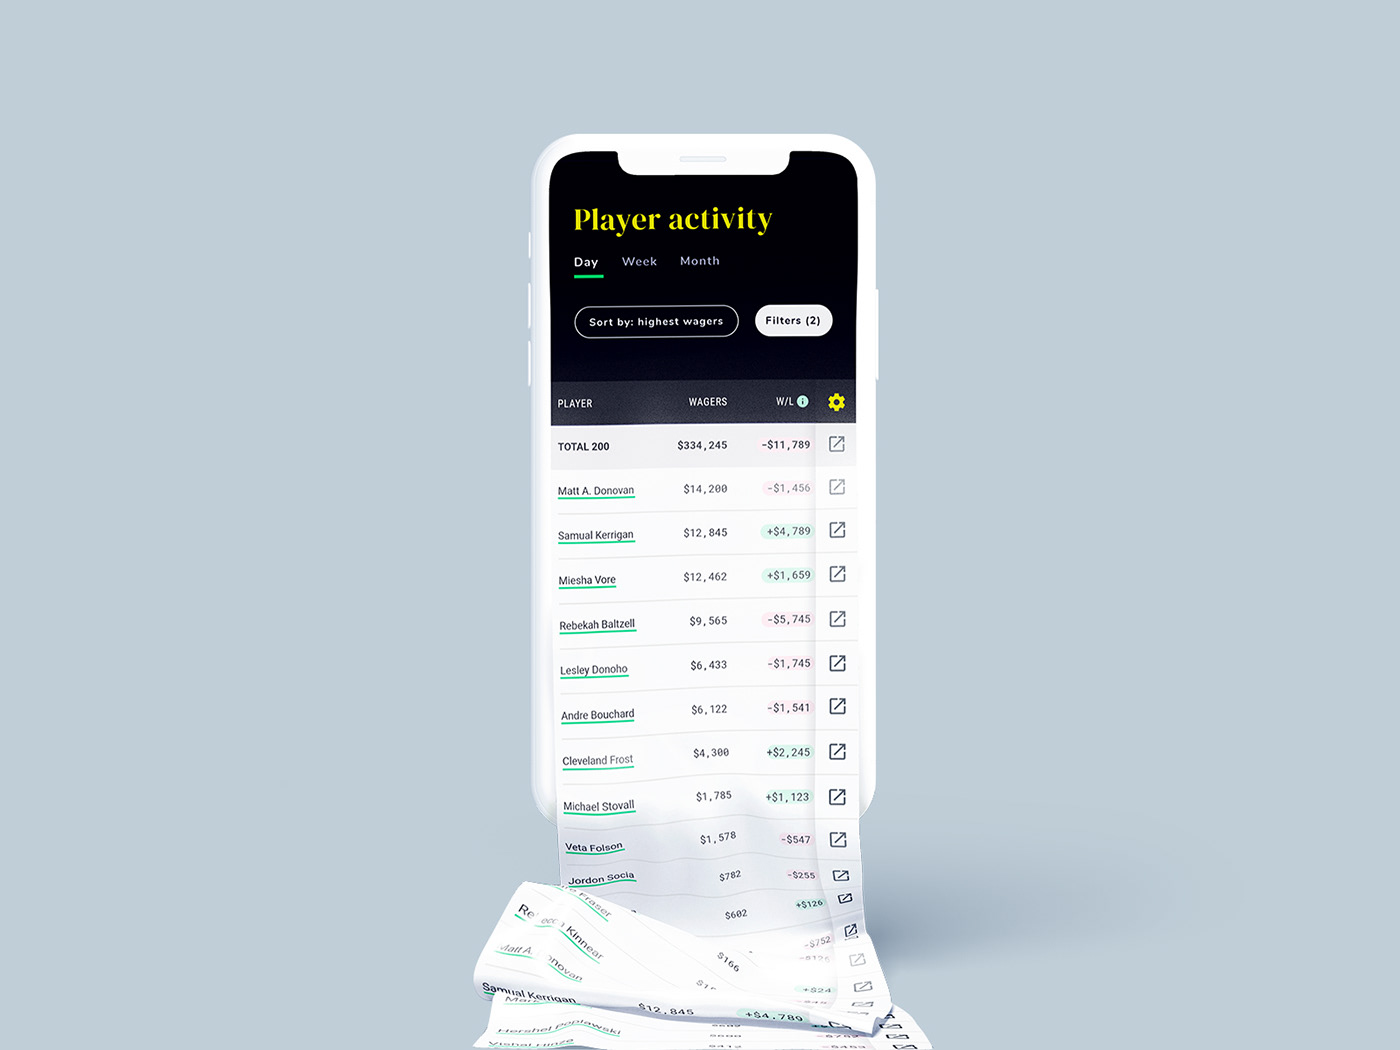
Sticky table header
Sticky table headers remain on top of the screen as the table is being scrolled, continuing to inform users about which column they see.
Floating Back to top button
This button appears at the bottom of the screen—at the thumb's reach—as the table is scrolled, allowing for an easy way to jump to the top of the page.

Customising rows
Users can customise what they see in their tables.
•Column visibility ON/OFF—users can hide irrelevant columns, getting them out of the way of the stuff they do care about.
•Reordering columns—users can choose to see the most relevant information first.
•Lockable left column—optional aid to help keep track of where we are in the table, at the cost of horizontal space
Tabs
Tabs are an intuitive way of grouping a set of reports together. This reduces cognitive load on users, and made the number of reports much more manageable. For example, we can join three reports (Player activity today, Player activity this week, and Player activity this month) into a single report called Player activity, with three tabs: Day, Week, and Month.

Typographic detail
Typographic detail needed to be very delicate and aggressive in the same time to accommodate as much data as possible on the little space the format offers. Without jeopardising legibility.
• Only the underline is coloured in links—Nothing provides more contrast, than black on white. Therefore displaying links at any other colour, would hinder legibility. Hence the link text is kept as black, and only the underline is coloured.
• Font choice—The Roboto family used for the tables has been developed by Google as the system font for its mobile operating system Android. It has been crafted to work well on mobile devices in small sizes, making it a good choice for for the task at hand. It's broad choice of variants caters for many scenarios.
• Lining numerals—Rows that contain numerical values are right aligned, and they use the font Robot Mono. Every number of it has the same width, so the numbers line up, providing a visual aid to comparing amounts.
• Condensed column titles—Column headers shouldn't be longer than the information in the column cells, otherwise valuable vertical space is wasted. This is especially difficult to avoid, because most of the columns contain dollar amounts, and until a user starts turning over big volumes, these numbers are bound to be short initially. So column headers are displayed with the condensed variant of Roboto. However, column headers still might need to be shortened, and in this instances they are supported by tooltips.
• Differentiating +/- number with background colour — the subtle red and green background colour for positive and negative numbers supports quick visual processing of information


